Kubernetes 自定义缩放: prometheus-adpater vs keda
背景
Kubernetes 官方主要支持基于 Pod CPU/Memory 的伸缩,这是应用最为广泛的伸缩指标,需要部署 metrics-server 才可使用。
可以对pod进行指标设置:
apiVersion: autoscaling/v2beta2
kind: HorizontalPodAutoscaler
metadata:
  labels:
    app: my-app
  name: my-app
spec:
  scaleTargetRef:
    apiVersion: apps/v1
    kind: Deployment
    name: my-app
  maxReplicas: 10
  minReplicas: 3
  metrics:
  - type: Resource
    resource:
      name: cpu #添加基于CPU的自定义弹性伸缩策略
      target:
        type: Utilization
        averageUtilization: 70
目前问题
1. 伸缩指标合理性:
如社区争论问题: https://github.com/kubernetes/kubernetes/issues/72811
其中计算使用率是通过request而不是limit. 因此如果使用率大于 request 但是没有到 limit, 这个使用率会是一个大于100%的值。 影响 使用率计算
2. 多容器pod计算策略问题:
使用率整体计算公式: CPU 使用率 = 100% * 所有 Container 的 CPU 用量之和 / 所有 Container 的 CPU requests 之和
	metricsTotal = sum(pod.container.metricValue)
	requestsTotal = sum(pod.container.Request)
	currentUtilization = int32((metricsTotal * 100) / requestsTotal)
计算出所有container的资源使用量再比总的申请量: 对于单容器 Pod 这没影响。但对于多容器 Pod,比如 Pod 包含多个容器 container1,container2(request 都为 1cpu),container1 使用率 10%,container2 使用率 100%,HPA 目标使用率 60%,按照设置使用率为55%不会进行扩容,但实际 container1 已经达到资源瓶颈,势必会影响服务质量。
3. 自定义指标注入:
集群中对于自定义指标进行扩缩容的场景比较多:
- 基于实例QPS
- 基于主机整体性能指标
- 基于外部vpc、底层网络资源、运维变更调整等
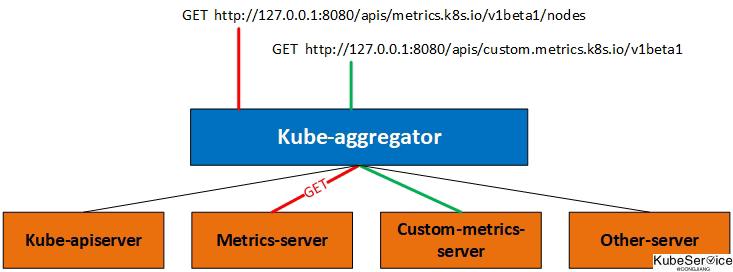
因此,kubernetes-sig 提供了custom-metrics-apiserver, 用于注册自定义指标.
4. 如何生成自定义指标:
-
通过
prometheus adapter生成聚合rule. prometheus的扩展性来手机各类数据:比如node-exporter收集主机信息,prometheus-nginx-exporter 采集流量信息等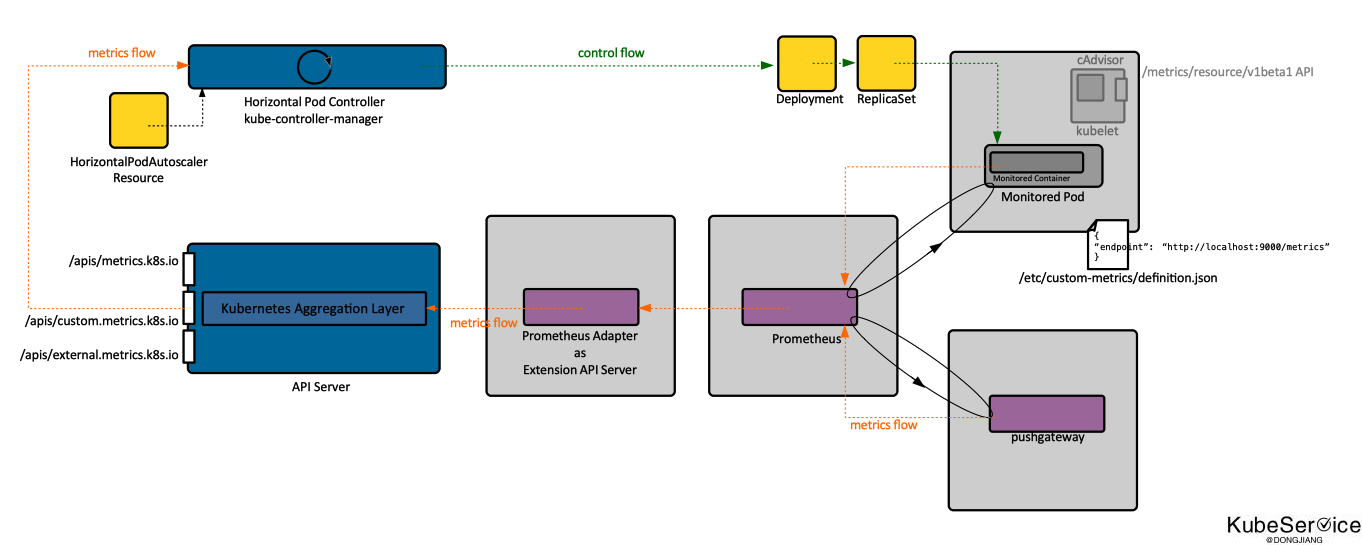
-
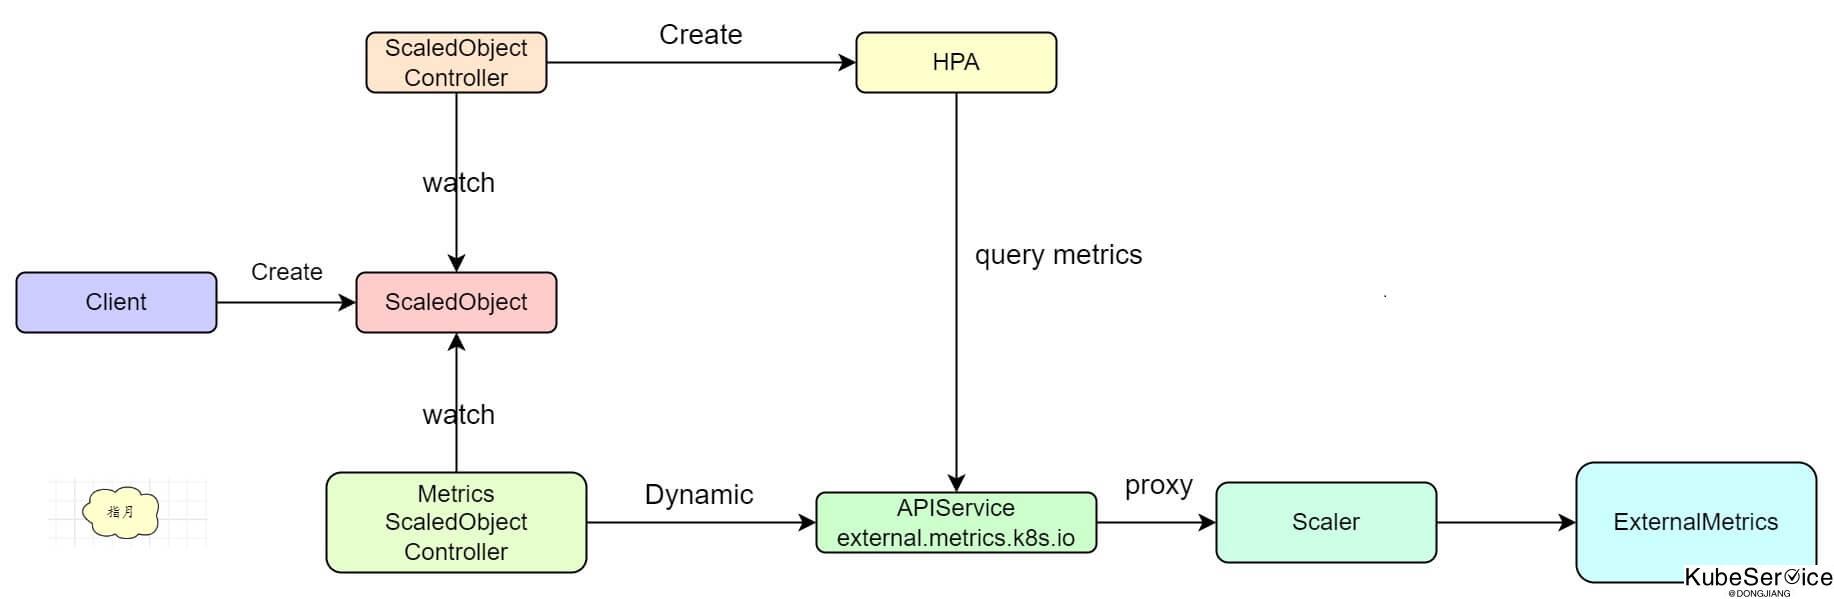
基于keda自定义的event源,来控制扩所容
5. 性能问题:
- 扩缩容过于敏感,导致 Pod 数量震荡
- Java VM Pod预热问题
- HPA-controller 并发性能;社区解决:https://github.com/kubernetes/kubernetes/pull/108501
keda
- 开启api-resources, 支持beta版本开启
kube-apiserver ----runtime-config api/beta=true ...
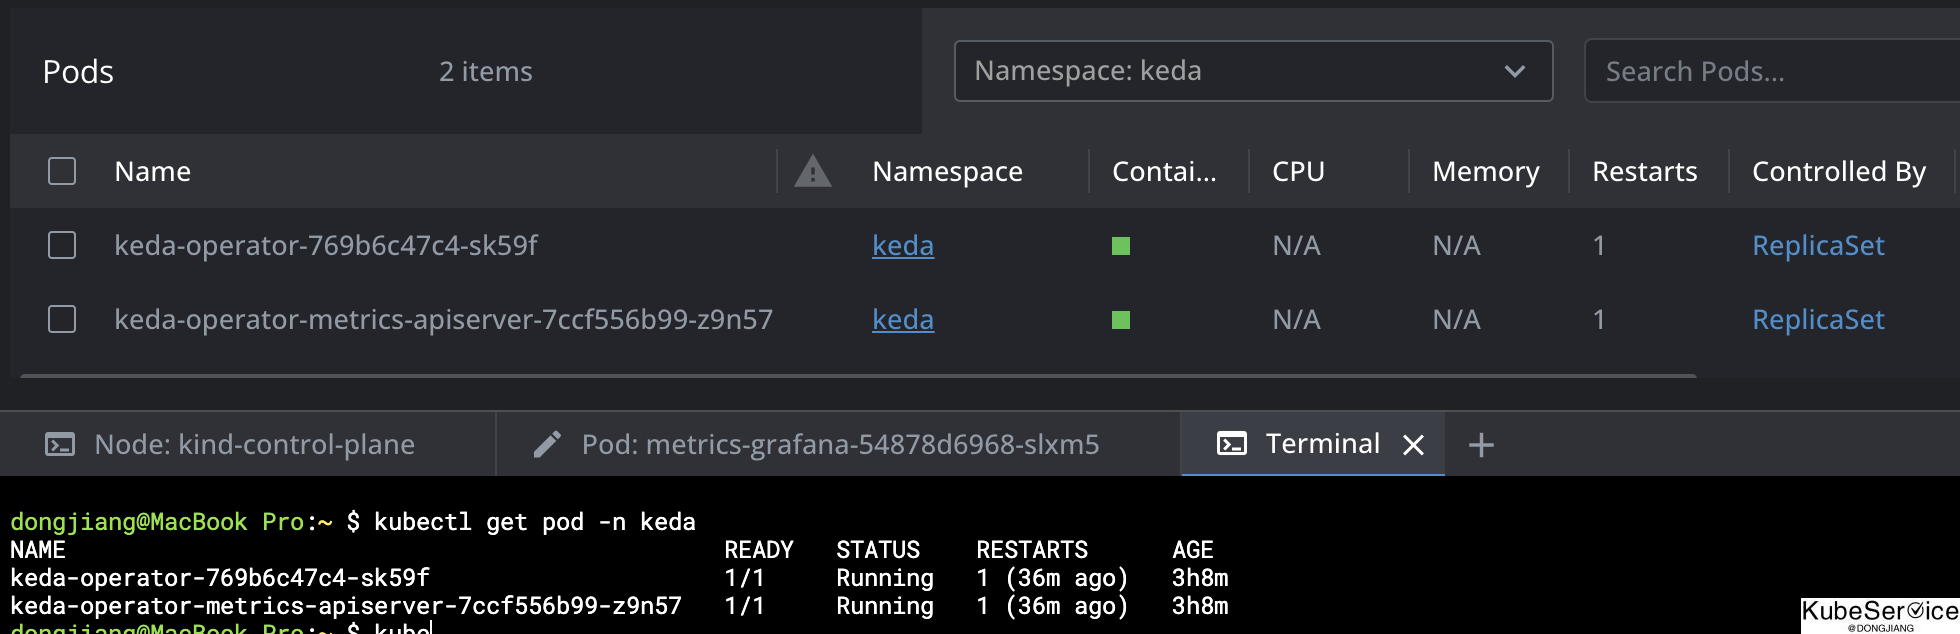
- 部署
helm repo add kedacore https://kedacore.github.io/charts
helm repo update
helm install keda kedacore/keda --namespace keda --create-namespace --version v2.9
- 设置ScaledObject规则
apiVersion: keda.sh/v1alpha1
kind: ScaledObject
metadata:
  name: prometheus-source
spec:
  scaleTargetRef:
    name: nginx
    apiVersion: apps/v1
    kind: Deployment
  triggers: #从prometheu数据源,获得node节点cpu资源利用率
  - type: prometheus
    metadata:
      metricName: node_cpu_usage_percentage
      serverAddress: http://metrics-kube-prometheus-st-prometheus.monitoring:9090/
      threshold: '4'
      query: (1 - sum(rate(node_cpu_seconds_total{mode="idle"}[1m])) by (instance) / sum(rate(node_cpu_seconds_total[1m])) by (instance) ) * 100
总结
KEDA 的好处就是,它内置了几十种缩放器,事件源含盖了大部分主流的应用.
其中 prometheus 类型事件源也可以代替 prometheus adapter ,用来做自定义指标的扩缩容,妥妥的扩缩容神奇。
prometheus adapter 优势在于:通过configmap 自闭环指标规则,采集靠prometheus;
keda 优势在于:出了prometheus外,支持事件源十分丰富,可支持多云、多监控环境下能力集合;
其他
「如果这篇文章对你有用,请随意打赏」